The line graphs below are a summary snapshot of all IOTN awards' collective publications, displayed on a cumulative scale beginning with the year of IOTN's conception and continuing through its 5-year funding period. The bar graph on the right shows the most common keywords based on "author-defined terms" from PubMed. The citations come from NIH iCite.
For each of the 31 IOTN awards, the bar graphs below represent "Total Publications," "Total Citations," and the "Relative Citation Ratio (RCR)". The publications were obtained using NIH Reporter award number queries, and the total citations and RCR were obtained from NIH iCite. Hovering the pointer over any column reveals additional information such as the award’s project title.
Below is a tabulated summary derived from the NIH reporter, including details on the IOTN award number, title, # of publication, # of citation, relative citation ratio, funding announcement, award start and end dates, and Principal Investigators for each of the 31 IOTN awards.
| Project ID | Title | Total Publications | Total Citations | Total RCR | FOA | Grant Type | Start Date | End Date | Contact PI |
|---|
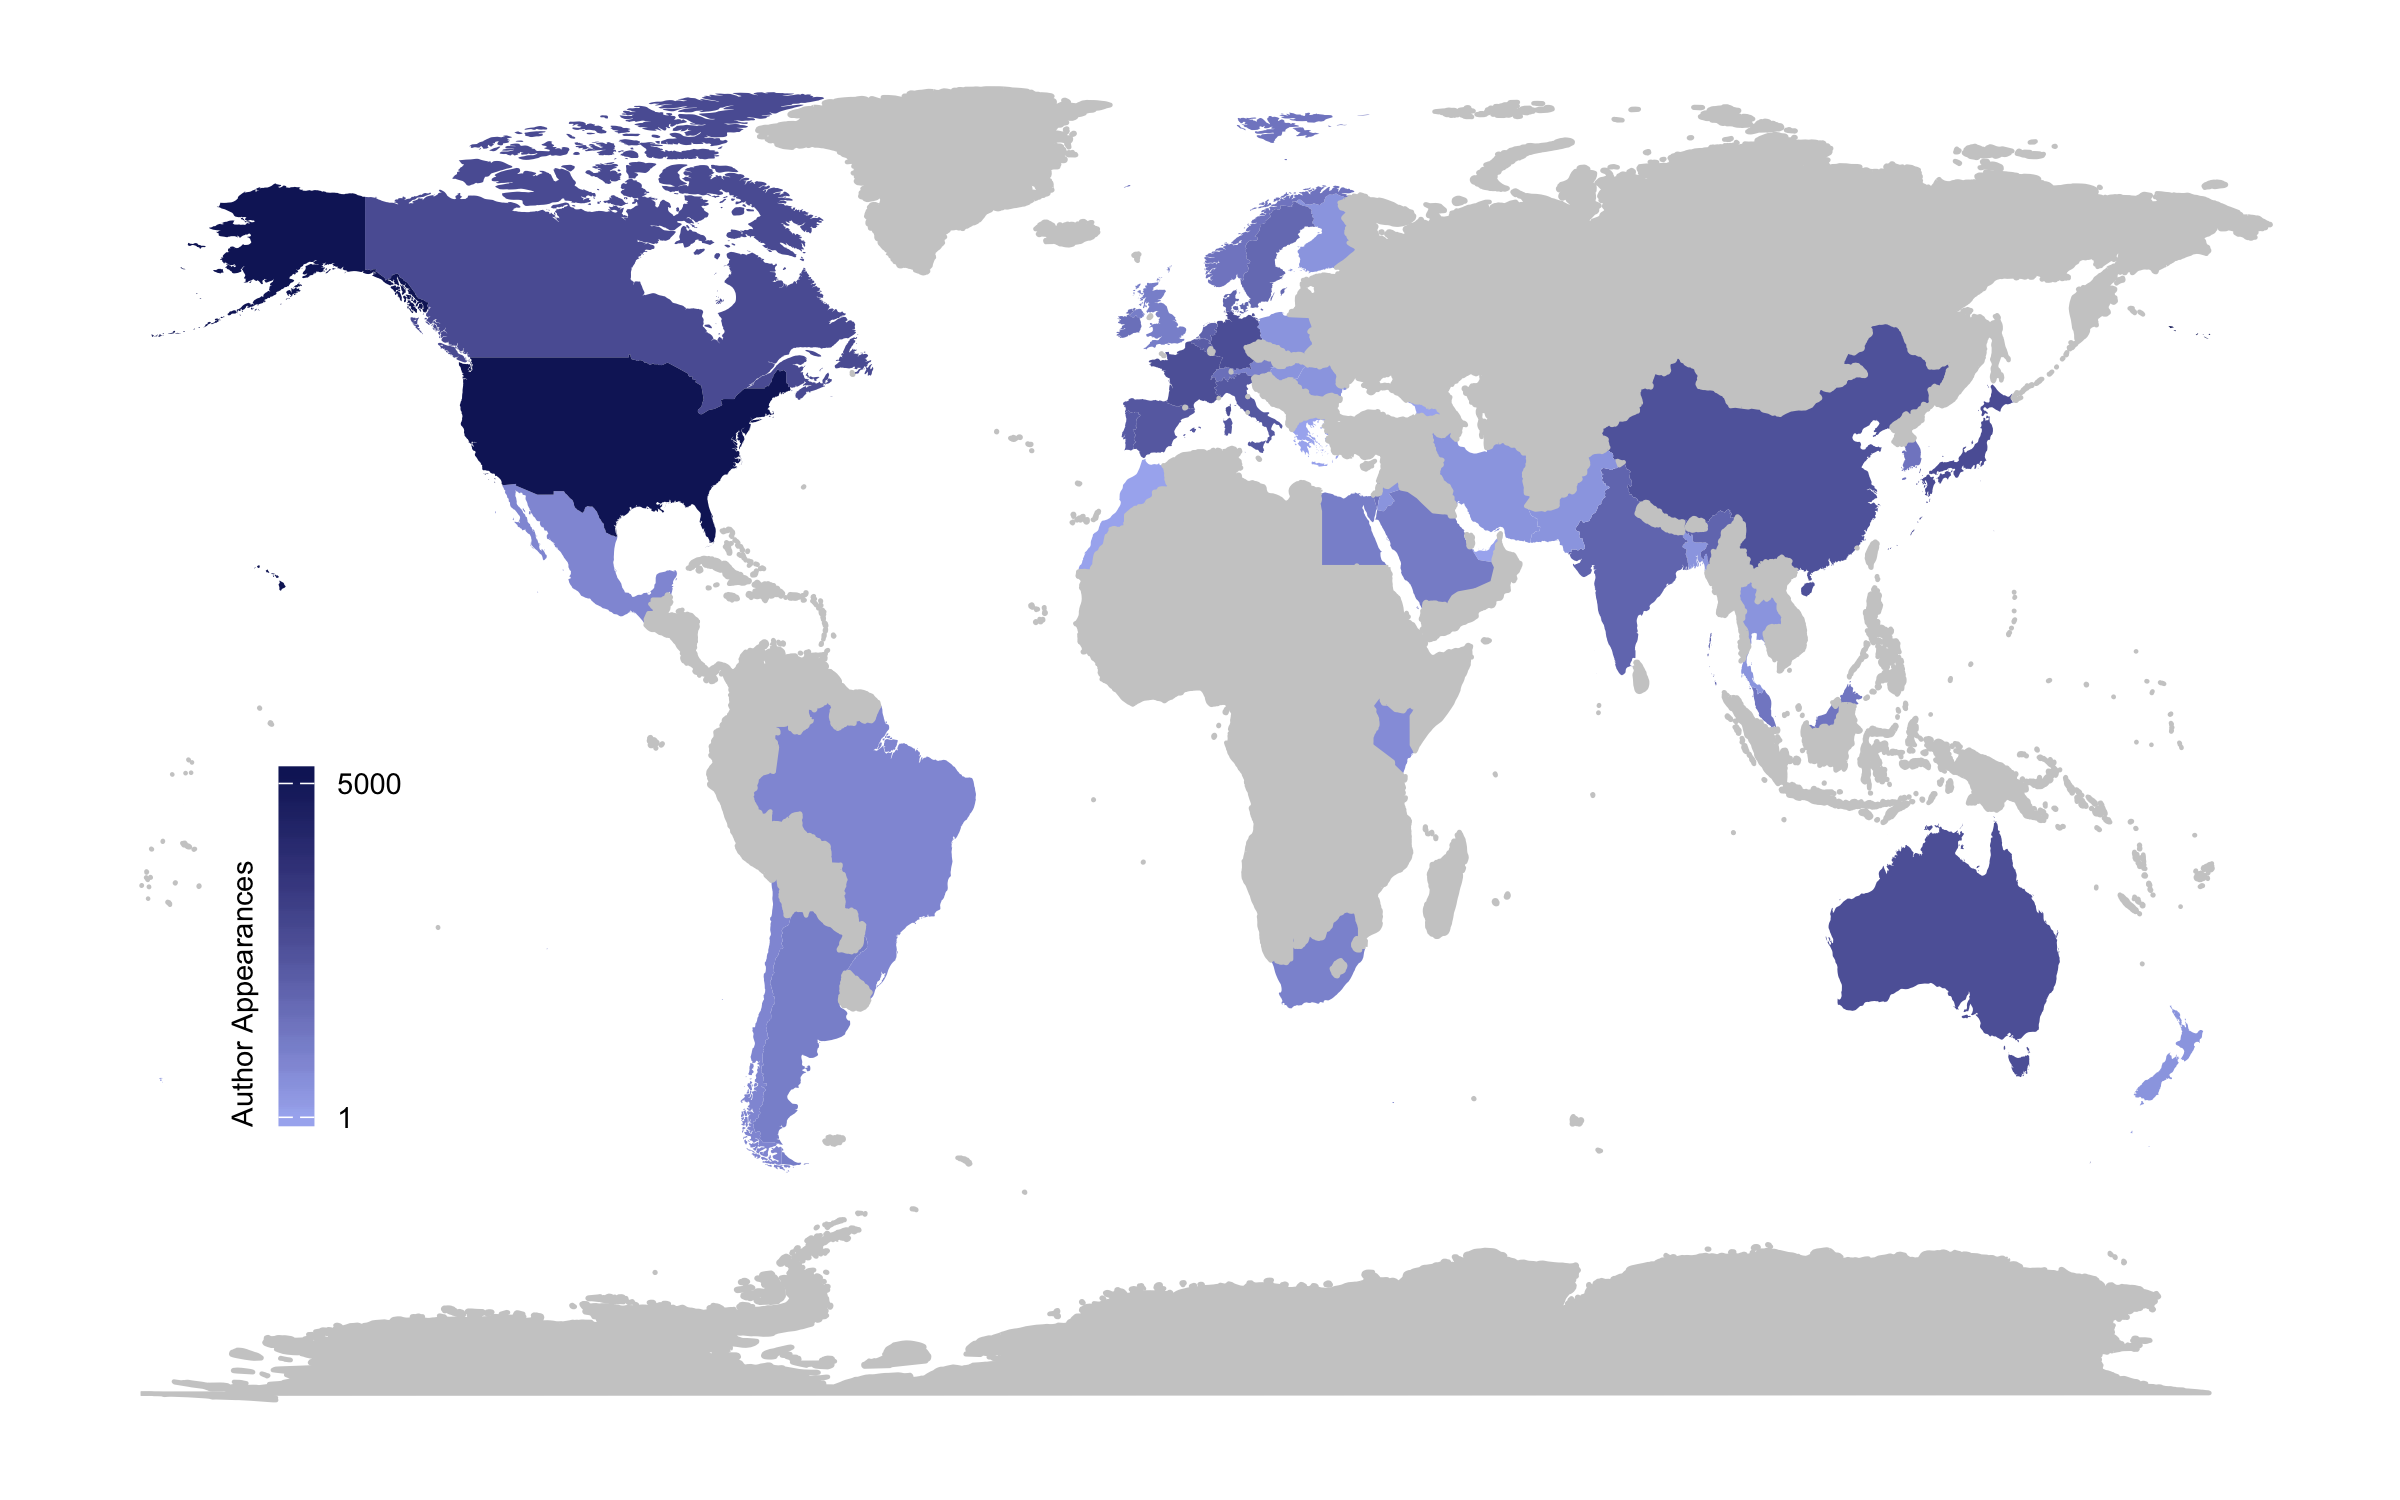
The map below depicts the Self-Reported Countries of all IOTN co-authors. This demonstrates the breadth of country-level collaboration for IOTN resulted works.
The graph below depicts intra-network collaboration of IOTN. This is determined by querying publications that acknowledges more than one IOTN award. The figure view can be zoomed in and out as needed. The width of the edges connecting the nodes is proportional to the square root of the number of co-publications; dashed lines indicate a single co-publication. Hovering the arrow over nodes displays the IOTN award number and title.
In addition to the IOTN intra-network research collaboration displayed above, the IOTN investigators have collaborated to prepare and publish IOTN White Papers, which lay out the network’s vision, organization, research focus, opportunities for engagement and collaboration with the broader scientific community, and accomplishments.
The IOTN shares its data and resources both within the network and with the larger community in order to maximize the value of its initiatives. The IOTN resource sharing catalogs include data, model, software, clinical trials and education. The graphs below are summary snapshots of the IOTN Data Sharing Catalog and the Clinical Trial Catalog, respectively.